
Configuring thresholds for creating health events in Amazon CloudWatch Internet Monitor | Amazon Web Services
You can now configure thresholds for when Amazon CloudWatch Internet Monitor creates health events for your applications internet traffic. Internet Monitor creates health events when availability or performance scores drop across your applications monitored geographies.
Internet Monitor provides near-continuous internet measurements for your internet traffic, including availability and performance metrics, tailored to your specific workload footprint on AWS. With Internet Monitor, you can get insights into average internet performance metrics over time, as well get alerts for issues (health events). Youre notified about events that impact your end user experience for application the clients access through Amazon CloudFront distributions, Amazon WorkSpaces directories, Network Load Balancers, or in Amazon Virtual Private Cloud VPCs.
Now, Internet Monitor provides options to configure when health events are triggered. You can now set custom thresholds for overall health events. In addition, Internet Monitor now creates health events when issues impact your client traffic at the city-networks levelthat is, client locations and ASNs, typically internet service providers (ISPs). You can customize configurations for local thresholds as well as overall thresholds. In this blog post, we explain how thresholds for health events work, and describe the customizations that you can make.
Previously, Internet Monitor only created health events when it determined that an issue had significant global impact; that is, when it exceeded a threshold percentage (set to 5%) of impact on internet traffic in your applications monitored locations. By only triggering health events that had application-wide impact, Internet Monitor didnt alert you to issues that had more local impact. Now you can get notified about events at a more granular level, based on your traffic and business needs , not just when availability and performance scores have dropped in aggregate.
Internet Monitor now has the following options for customizing thresholds:
- Configure the overall thresholds, when drops in overall availability and performance scores trigger health events.
- Configure the local thresholds, when drops in availability and performance scores for your applications city-networks trigger health events. With local thresholds, note the following:
- The same threshold applies to all city-networks. You cant configure a different threshold for different locations or ISPs.
- You specify a percentage threshold for how much the local issue affects your overall internet traffic. Internet Monitor only creates a health event when both a performance or availability score has dropped below the local threshold and when the impact on overall traffic is over the percentage that you set.
Based on parameters that you specify, Internet Monitor creates health events in the monitor for your application. You can view and customize health events on the Internet Monitor dashboard in the Amazon CloudWatch console, as well as by using Internet Monitor API operations with the AWS CLI or SDKs.
Lets walk through an example where a web application is hosted on Amazon Elastic Compute Cloud (EC2) servers. In this scenario, you want to monitor the overall end user experience, across all of your monitored internet traffic for the application, and also be notified when there are issues more locally.
To start using Internet Monitor, create a monitor and adding the resources from your applications that you want to monitor. Then, configure CloudWatch alarms to notify you when there are health events that affect your end users.
To create a monitor, navigate to Internet Monitor in the CloudWatch console, and then choose Create monitor. Enter a name for your monitor, and then choose Add resources.
For this example, you add a VPC resource, because you have a web application hosted on EC2. On the dialog page for resources, select the VPC to monitor, and then choose Add. Choose Next, review the configuration, and then choose Create monitor. It takes a few minutes for Internet Monitor to finish activating the monitor and begin publishing measurements. When the monitor is ready, the status is Active.
To see more information about your options when you create a monitor, see Getting started in the Internet Monitor user guide.
When your monitor is active, click the monitor to open the Overview page. The following screenshot (Figure 1), shows an example of an active monitor. You can see a summary about the current availability and performance scores, and information about health events for your monitored traffic.
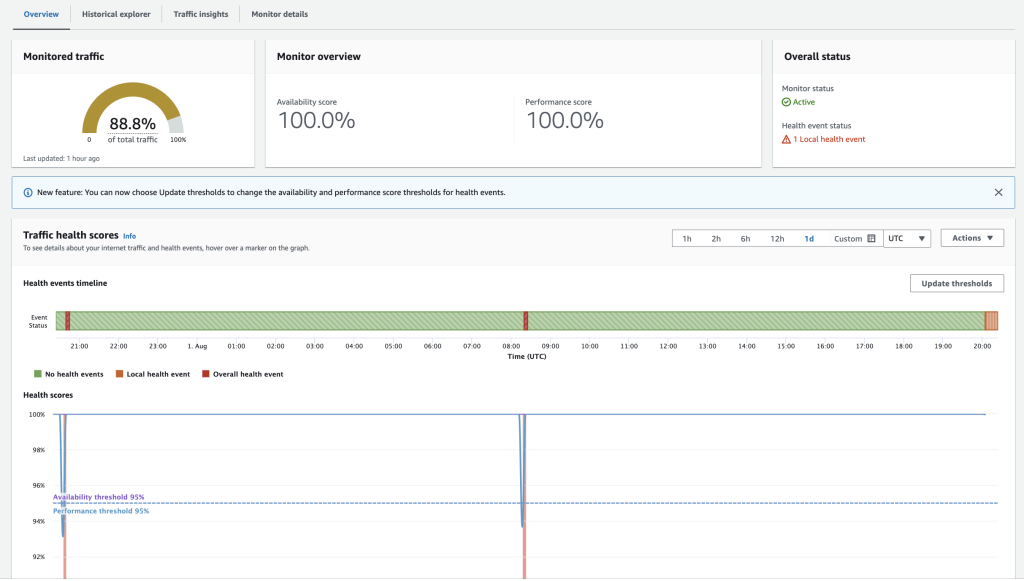
Figure 1. Screenshot of the Overview page on the Internet Monitor dashboard.
In the Traffic health scores section, in this example, you can see that the overall thresholds for creating a health event are the default, 95%, for each health score. Depending on the client traffic to your application in different geographies, health scores might only drop below the 95% threshold when there is a significant global outage, or several smaller outages.
You can set higher or lower overall thresholds for when Internet Monitor creates a health event, and make other customizations for thresholds. On the Overview page, choose Update health event thresholds. On the Set health event thresholds dialog page, shown in the following screenshot (Figure 2), and make any desired changes, and then choose Update health event thresholds.
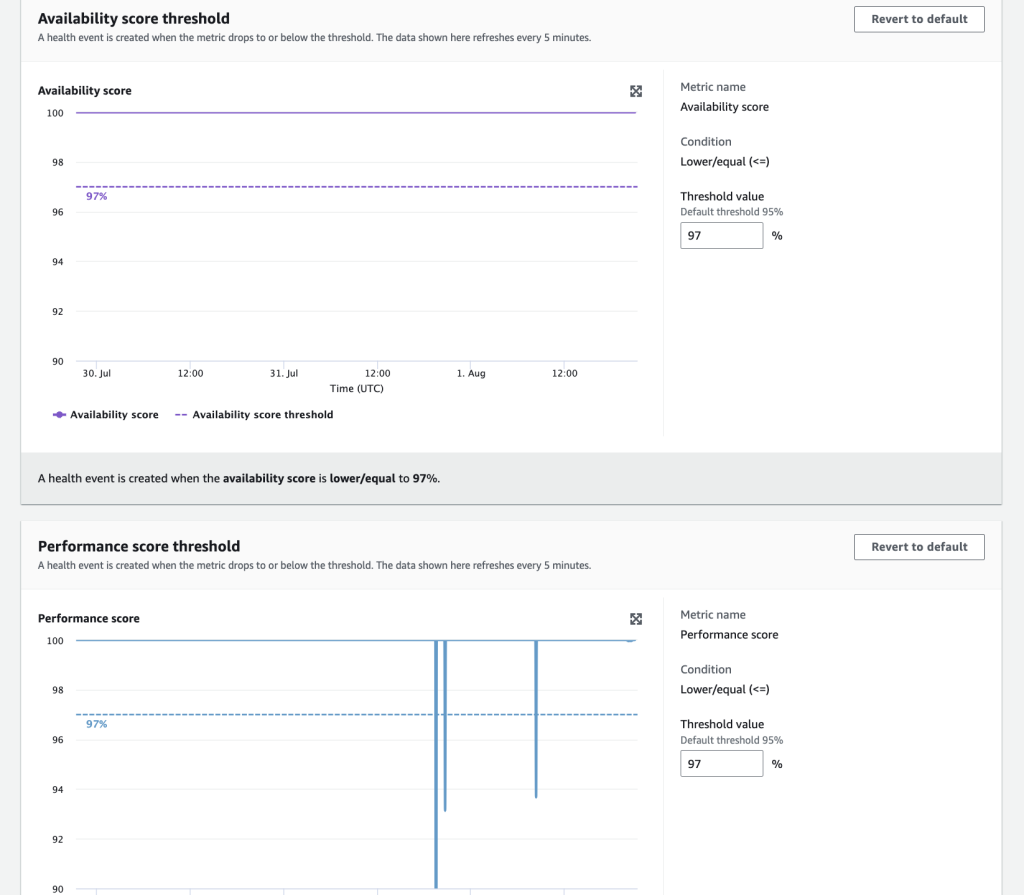
Figure 2. Screenshot of Set health event thresholds dialog page on the Internet Monitor dashboard
On this page, you can configure different options for thresholds, depending on your application traffic and needs. To start, you can change the threshold value for the overall availability score, performance score, or both. You can open an expanded graph with a longer timeframe so that you can evaluate the impact of changes on more health events, as shown in the following screenshot (Figure 3). To see the Expanded graph dialog page, in the Availability score threshold or Performance score threshold sections, click the expander, on the same line as the graph title.
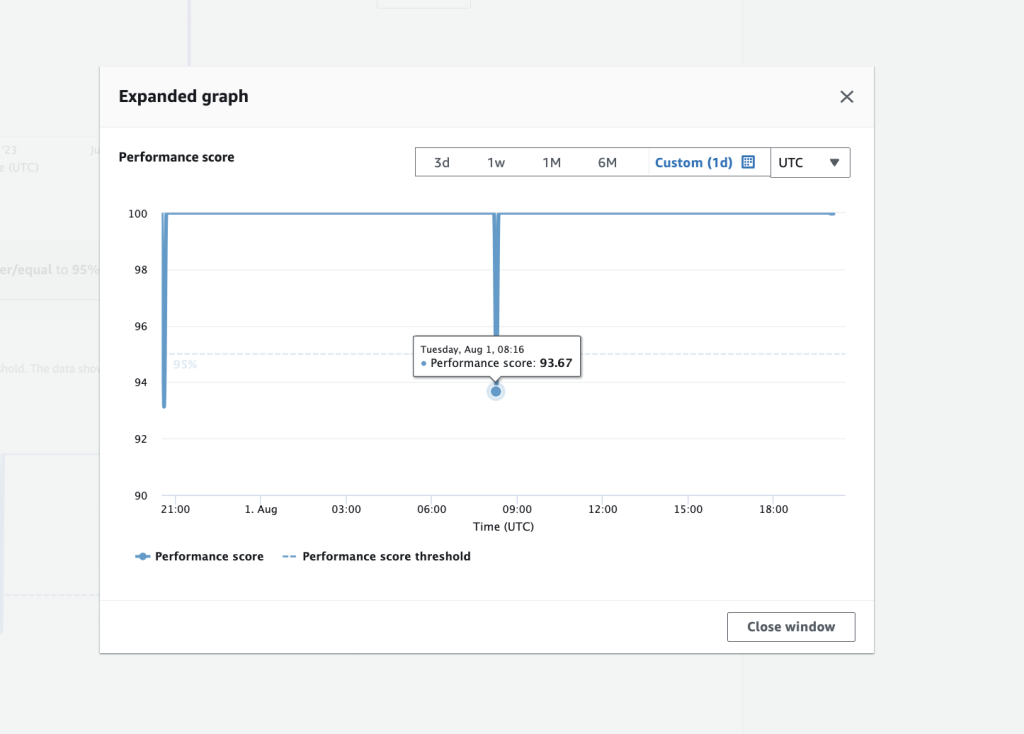
Figure 3. Screenshot of Performance score graph on the Internet Monitor dashboard.
When you update the threshold values, the graphs adjust. After you review the effect of specific threshold values on when health events would be created, you can choose Close to return to the previous page.
For example, if you modify the availability threshold to 99%, the Availability score graph changes as follows: Internet Monitor updates the preview to draw a new line for the updated threshold, to show the effect of the change on when health events would be created. The values that it uses are recent historical information for your application traffic.
When youre happy with the updates that youve set for the thresholds, apply the change by clicking Update health event thresholds.
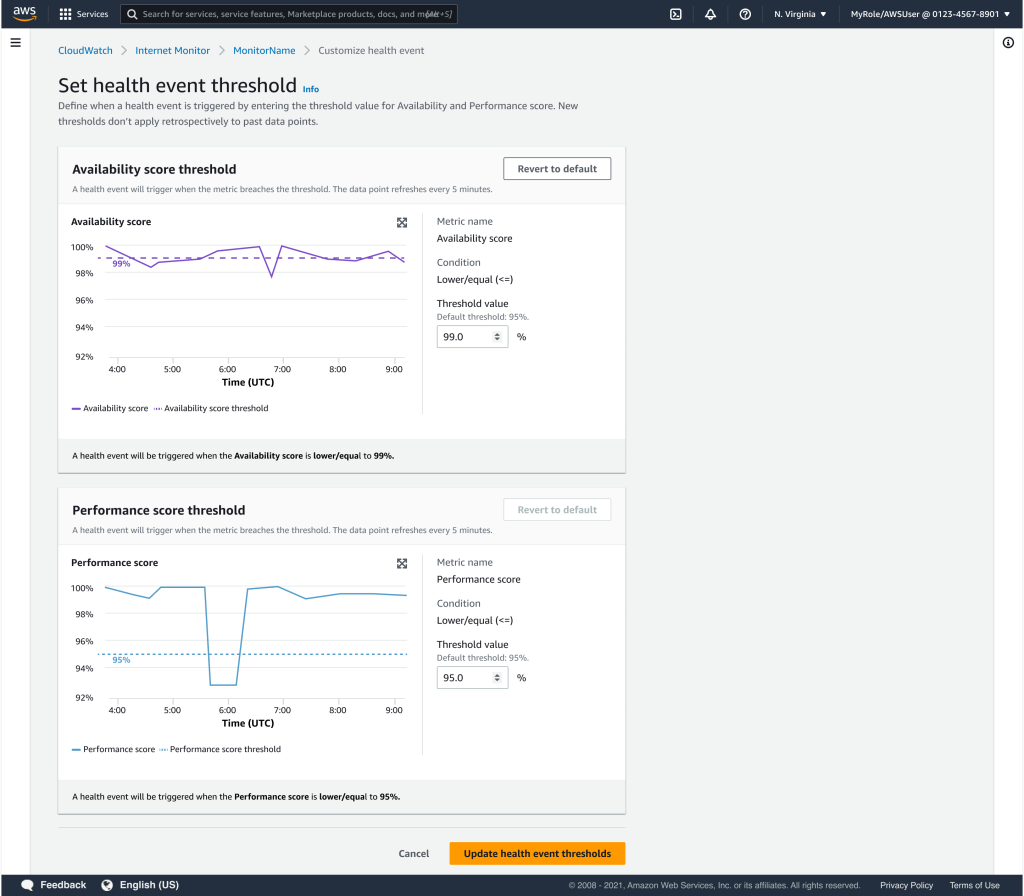
Figure 4. Screenshot of the Set health event thresholds dialog page on the Internet Monitor dashboard with an updated availability threshold.
When you complete your updates, you return to the Overview page in the dashboard. As the following screenshot shows (Figure 5), the threshold for availability scores in the Traffic health scores graph now reflects the change that you made.
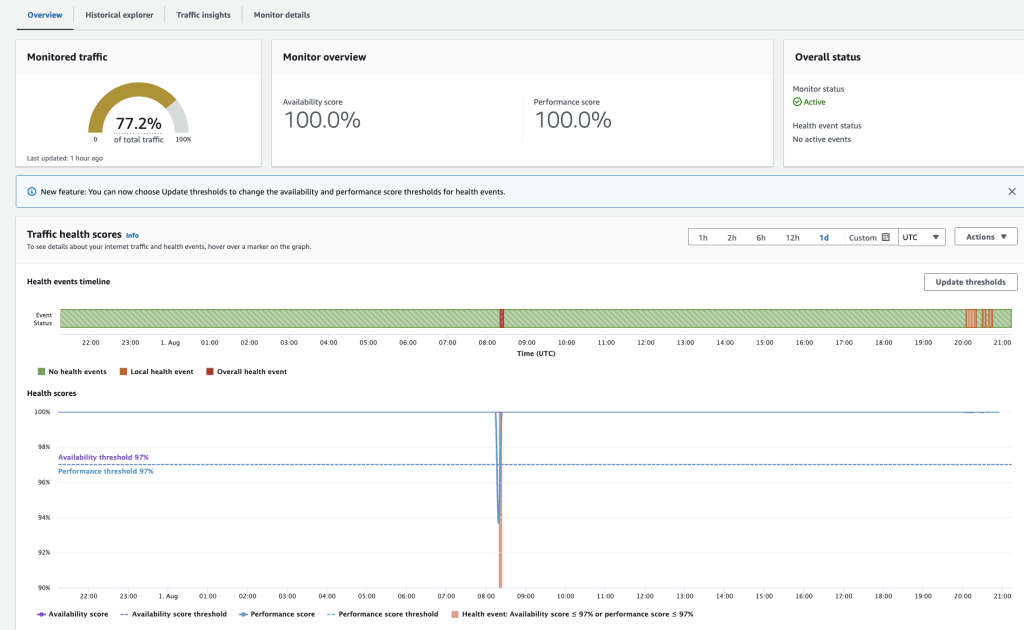
Figure 5. Screenshot of the Overview page on the Internet Monitor dashboard with an updated availability threshold
At any time, you can reset to use the default values for availability and performance score thresholds (95%). Choose Update threshold, and then, on the Set health event thresholds dialog box, choose Revert to default. To apply the change, choose Update health event thresholds.
You can configure options for local thresholds in the same dialog box where you make changes to overall thresholds. Choose Update thresholds, and then, on the Change health event thresholds dialog box, choose Thresholds for local health events. The options that you can configure for local thresholds are shown in the following screenshot (Figure 6). Note that the default local thresholds for performance and availability scores are 50%, and the default percentage thresholds for the total traffic impacts is 0.01%.
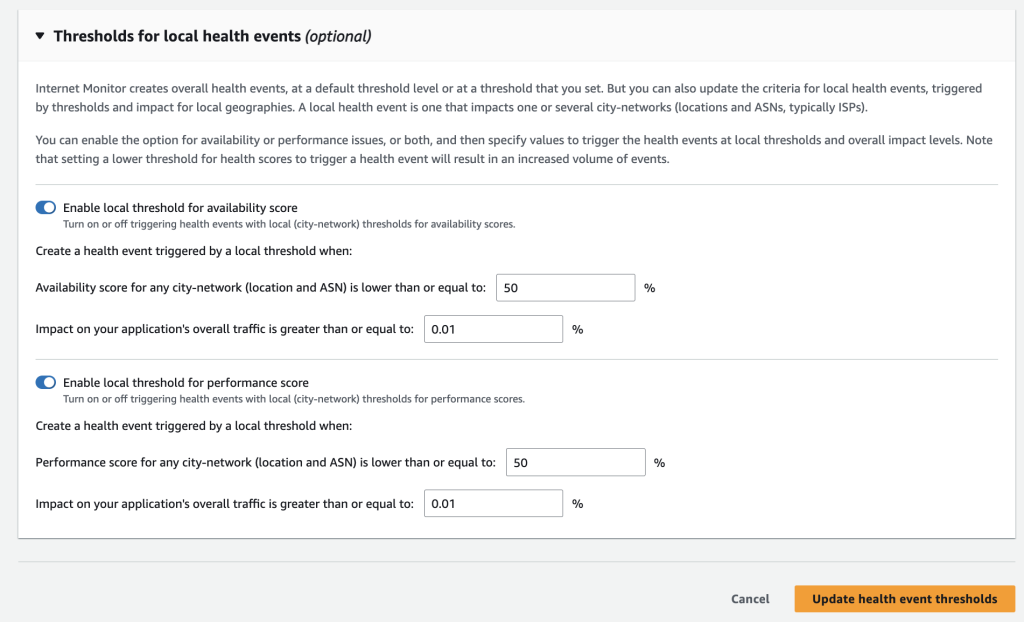
Figure 6: Screenshot of Thresholds for local health events dialog box, expanded to show the options that you can configure for local thresholds
To turn off using local thresholds to create health events, click the toggle for availability score, performance score, or both, as shown in the following screenshot (Figure 7).
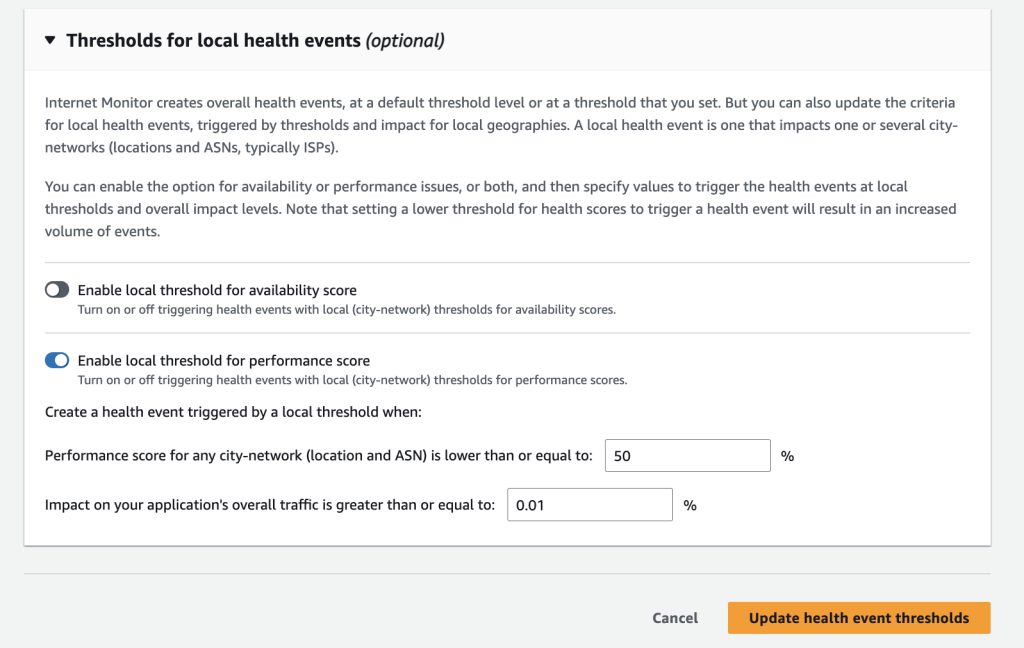
Figure 7. Screenshot of Thresholds for local health events section of the dialog box for updating thresholds, with the toggle Off for availability score.
After you configure overall and local thresholds, you can use the event timeline graph and the map view on the Overview page to see summary and expanded views of all current health events, as well as location-based views. You can also scroll down to see a list of health events in a table format.
On the Overview page, the Health events timeline and Health score graph show summaries of your health events, in formats similar to CloudWatch alarm patterns. The timeline and graph provide aggregated representations of your applications health events, and the thresholds that triggered them. The following screenshot shows an example of a Health events timeline and a Health score graph (Figure 8).
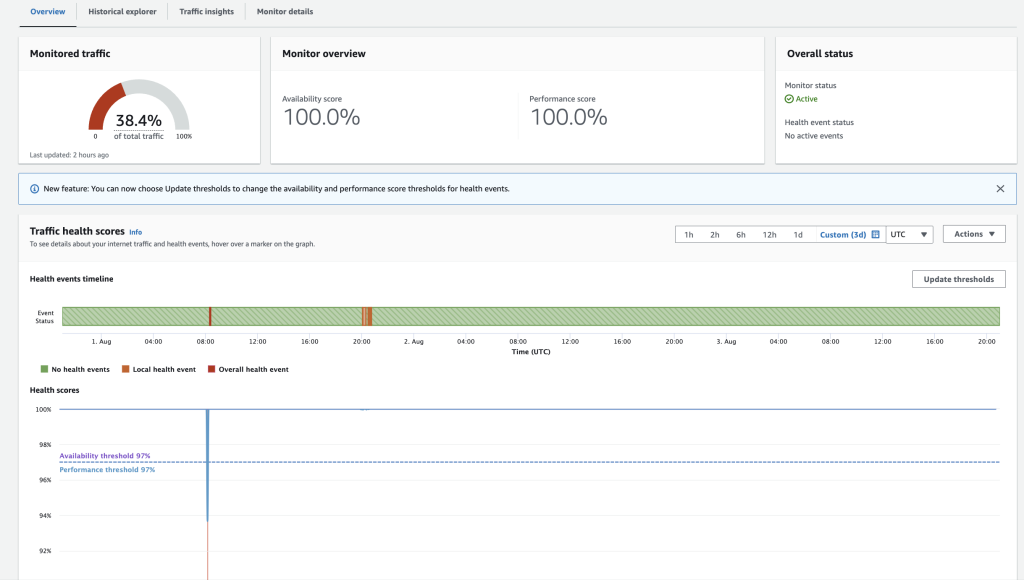
Figure 8. Screenshot of the Overview page on the Internet Monitor dashboard with the updated health events timeline
To see health event details, hover over sections on the timeline, as shown in the following screenshots (Figure 9).
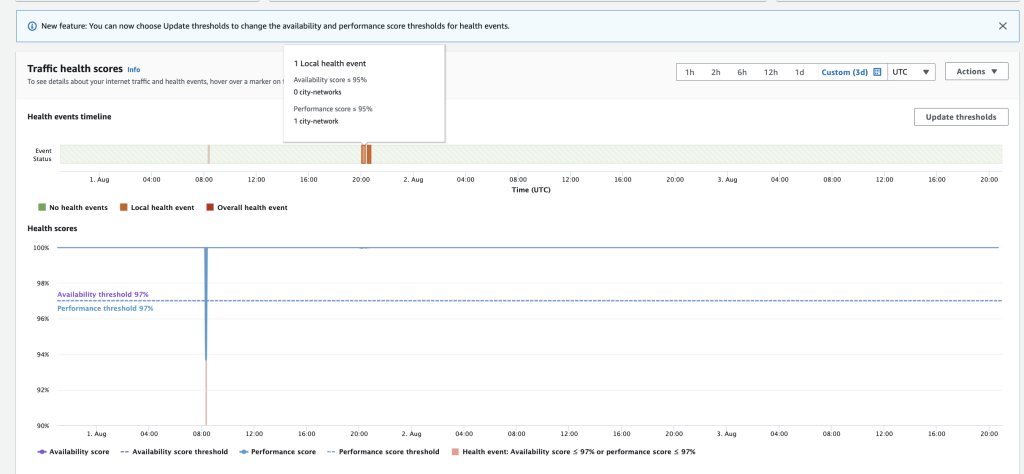
Figure 9. Screenshot showing hover text for the Health events timeline on the Overview page
In the map just below the timeline and graph, current health events are highlighted, as shown in the following screenshot (Figure 10).
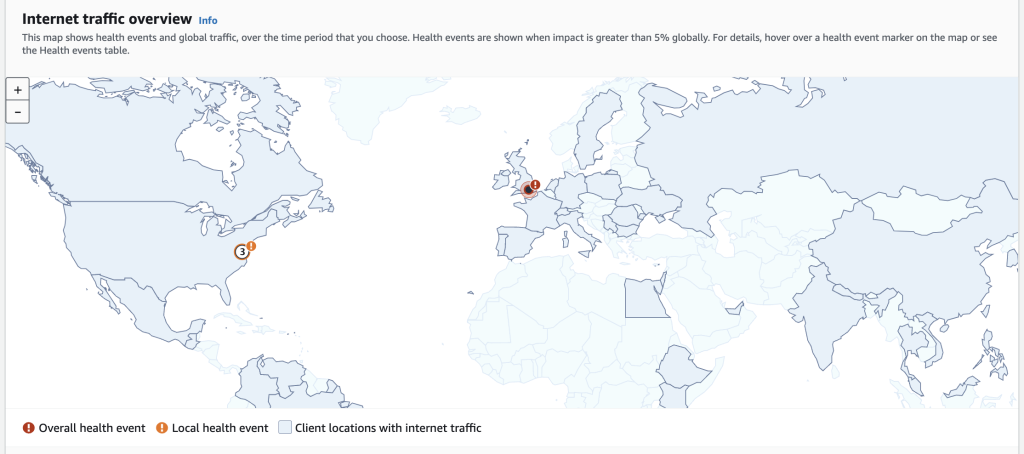
Figure 10. Screenshot showing health events triggered by local and overall thresholds, as shown on the traffic map on the Overview page.
Events that are triggered by overall thresholds are highlighted with red markers; events triggered by local thresholds are highlighted with orange markers. To see details about a health event, hover on a marker.
The Overview page also includes a table of your applications health events. By default, the Health events table includes details about all events that have been triggered for your applications monitored traffic by the configured thresholds. However, you can filter the table to show only certain groups of health events. Using the All events drop-down menu, as shown in the following screenshot (Figure 11), you can filter the table to show only events triggered by overall thresholds, or show only events triggered by local thresholds.
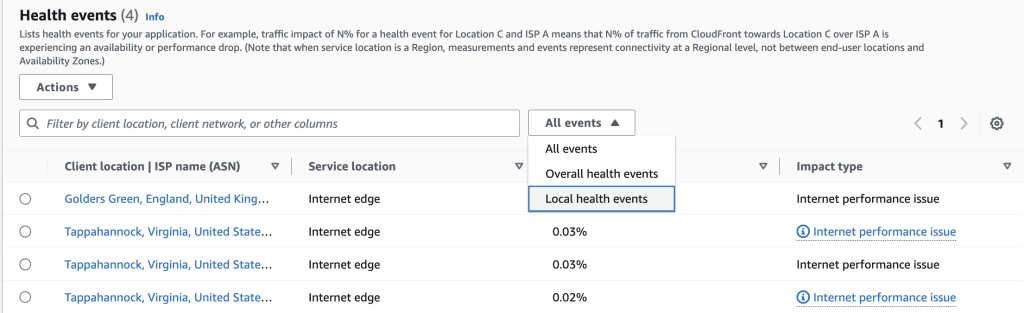
Figure 11. Screenshot of Health events table including details about all events
In this blog post, we explained how you can configure custom thresholds for availability and performance scores in Amazon CloudWatch Internet Monitor, including overall thresholds and local (city-networks) thresholds. We also described how Internet Monitor displays health events in the CloudWatch dashboard in the console, so that you can easily view the impact of different health events on your applications clients, for traffic that you monitor. Get started using Internet Monitor for your application today, to take advantage of continuous observability of internet measurements, including availability and performance, tailored to your workload footprint on AWS.