Oracle Vs. IBM: Battle Of The Software & Services Giants (NYSE:ORCL)
wellesenterprises 1")
In this analysis, we conducted a comparison between Oracle Corporation (NYSE:ORCL) and International Business Machines Corporation (IBM), two of the world’s largest tech companies boasting market caps of $315.75 bln and $166.46 bln, respectively. We focused on these two companies due to their relatively established and matured nature in the Software sector, characterized by stable revenue growth, profit margins and increased debt capacity. Firstly, we analyzed their revenue growth performance by examining their revenue breakdown by subindustries and their market shares. Additionally, we evaluated the profitability of both companies by analyzing their gross, EBIT, net and FCF margins. Moreover, we compared their ROA, ROE and ROCE ratios, alongside asset and equity turnover ratios. Lastly, we conducted a comparative analysis of their financial standing, examining trends in net debt, as well as credit and liquidity ratios.
Which has the Better Growth Outlook?
For this section, we examine the breakdown comparison of both companies and their revenue growth performance.
Revenue Breakdown and Performance
Company Data, Khaveen Investments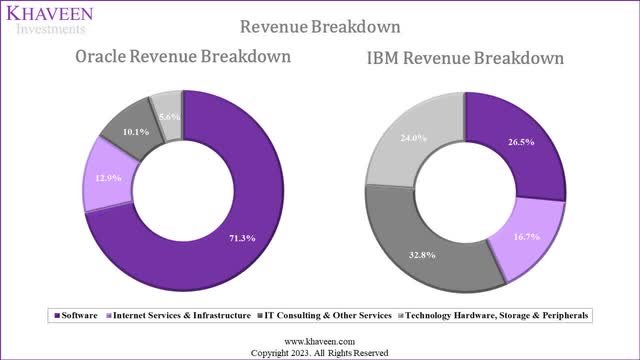
Based on the chart above, we derived the revenue breakdown of IBM and Oracle in terms of their subindustries. As seen, IBMs revenue breakdown shows it is more diversified with its segments more evenly distributed compared to Oracle which largest segment (software) accounts for 71.3% of its revenue compared to the largest segment of IBM (IT Consulting & Other Services) at 32.8% of revenues.
|
IBM Revenue by Segment ($ mln) |
2020 |
2021 |
2022 |
2023 |
Average |
|
Internet Services & Infrastructure |
6,905 |
8,700 |
9,321 |
10,169 |
|
|
Growth % |
26.0% |
7.1% |
9.1% |
16.6% |
|
|
Software |
15,219 |
14,726 |
15,716 |
16,139 |
|
|
Growth % |
-3.2% |
6.7% |
2.7% |
1.7% |
|
|
IT Consulting & Other Services |
16,257 |
17,844 |
19,107 |
19,985 |
|
|
Growth % |
9.8% |
7.1% |
4.6% |
8.4% |
|
|
Technology Hardware, Storage & Peripherals |
14,533 |
14,188 |
15,288 |
14,593 |
|
|
Growth % |
-2.4% |
7.8% |
-4.5% |
2.7% |
|
|
Total Company Revenue |
54,377 |
56,636 |
60,530 |
61,860 |
|
|
Growth % |
4.2% |
6.9% |
2.2% |
5.6% |
Source: Company Data, Khaveen Investments
|
Oracle Revenue By Segment ($ mln) |
2020 |
2021 |
2022 |
2023E |
Average |
|
Internet Services & Infrastructure |
2,590 |
3,560 |
4,500 |
6,900 |
|
|
Growth % |
37.5% |
26.4% |
53.3% |
39.1% |
|
|
Software |
32,409 |
32,492 |
36,586 |
38,043 |
|
|
Growth % |
0.3% |
12.6% |
4.0% |
6.6% |
|
|
IT Consulting & Other Services |
3,021 |
3,205 |
5,594 |
5,411 |
|
|
Growth % |
6.1% |
74.5% |
-3.3% |
25.8% |
|
|
Technology Hardware, Storage & Peripherals |
3,359 |
3,183 |
3,274 |
2,965 |
|
|
Growth % |
-5.2% |
2.9% |
-9.4% |
-3.9% |
|
|
Total Company Revenue |
40,479 |
42,440 |
49,954 |
53,319 |
|
|
Growth % |
4.8% |
17.7% |
6.7% |
9.8% |
Source: Company Data, Khaveen Investments
Comparing the companys average segment revenue growth in the past 3 years, Oracle surpasses IBM with a higher growth rate in all segments except for Technology Hardware, Storage & Peripherals. The greatest difference in the performance is the IT Consulting & Other Services with Oracles average being 3x higher than IBM boosted by its growth in 2022 following its Cerner acquisition. We further examine each of the companys segments competitiveness below by analyzing their market share.
Software
Company Data, Khaveen Investments 2")
Firstly, in Software, both companies software revenue share of the top 10 software companies has eroded over the past 4 years as increasing competition from faster-growing competitors such as Microsoft (MSFT), Salesforce (CRM) and Adobe (ADBE) gained share. Though, comparing between Oracle and IBM, Oracle has a larger share at 17% in 2022, above IBMs 7.2% share. As previously highlighted, Oracle software spans its ERP and database software offerings. For its ERP, we highlighted the companys high feature breadth as an advantage to the company but believed its higher pricing affects its competitiveness. On the other hand, IBM has 476 software products for applications including analytics, IT infrastructure and business operation. However, we highlighted IBMs features and customer rating disadvantage compared to competitors such as Microsoft and Oracle. In database software, we also analyzed Oracles decreasing competitive position as larger cloud-based competitors such as AWS and Microsoft rapidly gain share and over the company. However, we identified that Oracle still has a stronger feature breadth compared to IBM for its database software. Overall, we believe Oracle is more competitive than IBM in software.
Internet Services & Infrastructure
Synergy Research, Company Data, Khaveen Investments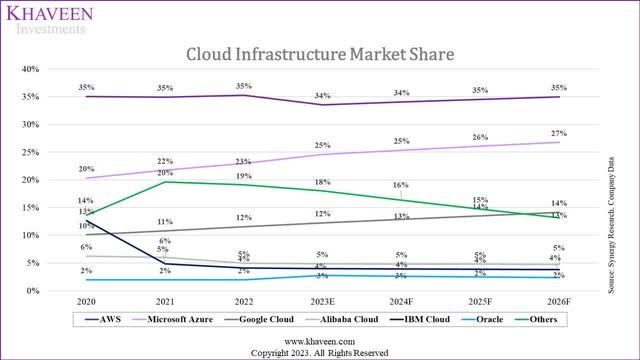
In the cloud market, IBMs market presence has been larger compared to Oracle with a slightly larger market share compared to Oracle. Though, larger competitors such as AWS (AMZN), Microsoft and Google (GOOG) are superior to both companies as these companies dominate the cloud market accounting for 77% of the combined market share. Based on our analysis, Oracle has a greater data center presence with a higher number of availability zones than IBM, however, IBM cloud edges out Oracle with more competitive pricing, more cloud services and AI-related features.
Company Data, Khaveen Investments
Furthermore, we believe Oracles larger data center footprint supports its strategy to cater to the broader public cloud market. However, we see IBMs advantage over Oracle with its larger breadth of cloud services including AI-related services supported by the companys strategy on internal product development and also a large breadth of AI patents. Additionally, we previously highlighted that while Oracle pursues partnerships with cloud providers such as Microsoft, we believe it could pose a risk of its customers being enticed to switch to Microsoft. Thus, we believe IBMs cloud is more competitive than Oracle’s.
IT Consulting & Other Services
In IT Consulting & Other Services, both companies provide IT consulting services. However, one of the differences is that IBMs revenues are much higher (3.7x) compared to Oracle and represent a significant share of its revenue (32.8%), its largest segment. Oracles IT consulting services are centered around its own technologies to help its customers maximize the performance of their investments in Oracle applications and infrastructure technologies. We believe this could benefit Oracle by helping its customers use its products and creating upselling opportunities.
Whereas IBM, its IT consulting activities span across a diverse range of services and has its IBM Garage method which is an end-to-end model for accelerating digital transformation at scale with a range of strategic partnerships with top tech companies including AWS, Salesforce, Microsoft, SAP (SAP), Adobe and even Oracle with thousands of dedicated Oracle cloud consultants to help customers cloud implementation. IBMs IT consulting had been supported by M&A as the company emphasized in its annual report it had made 8 acquisitions related to IT consulting and added:
consulting capabilities to address specific client challenges, including environmental performance management software (Envizi), cybersecurity attack surface management (Randori), and digital transformation services for the U.S. federal government (Octo).
Overall, we believe IBMs greater scale and diversity of its IT Consulting highlights an advantage over Oracle with a larger market, however, we believe Oracles IT consulting activities are more specialized and focused on driving the companys organic growth, thus we believe Oracles IT consulting segment is superior to IBM as part of its strategy to support its growth.
Technology Hardware, Storage and Peripherals
IDC, Statista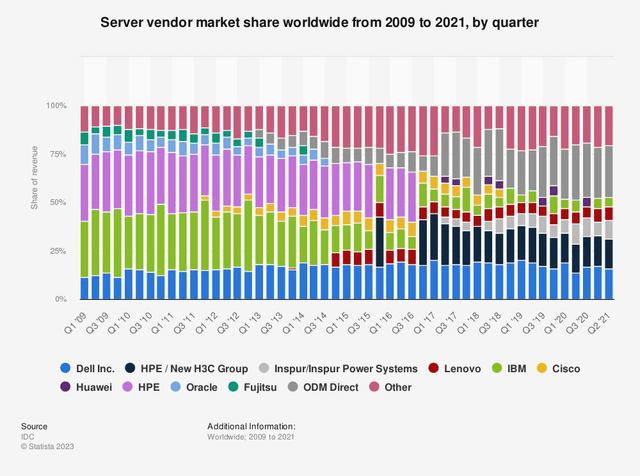
In the server market, Oracle and IBMs market shares are relatively low compared to other competitors such as market leader Dell. Though, Oracles market share has not been reported by IDC since 2015 onwards, indicating an insignificant market share. In our previous analysis, we highlighted that Oracle focused on legacy products as one of the reasons for its decline in the market. On the other hand, IBM focused on arm-based servers but had also lost market share.
IDC, Statista
Furthermore, besides servers, IBM also has a presence in the enterprise external OEM storage systems market with its product lines including IBM Storage FlashSystem, Storage DS8K, Storage Scale and Storage Fusion. According to TechTarget, IBMs storage systems such as its Storage FlashSystem are hybrid cloud compatible, which we believe supports its hybrid cloud strategy. Also, its Storage DS8K integrates with its server hardware like its IBM zSystem mainframe systems, highlighting its product integration. Based on the chart above, the companys market share has also deteriorated, similar to its declining position in the server market. Thus, we believe its segment has been outcompeted by the rise of larger cloud competitors including AWS, Microsoft and Google. Therefore, we believe both companies are uncompetitive in the server and storage systems market and continue to face tough competition in both markets from other larger competitors and ODM companies in the server market. Notwithstanding, as IBM has a higher market share in server and storage systems, we believe it edges out Oracle in Technology Hardware, Storage and Peripherals.
Conclusion
|
Factor |
Advantage |
|
Revenue Breakdown and Performance |
Oracle |
|
Software Competitiveness |
Oracle |
|
Internet Services & Infrastructure Competitiveness |
IBM |
|
IT Consulting & Other Services Competitiveness |
Oracle |
|
Technology Hardware, Storage and Peripherals Competitiveness |
IBM |
|
Overall |
Oracle |
Source: Khaveen Investments
Overall, we see Oracle as the superior company compared to IBM due to its stronger revenue growth performance in all segments except for IT Consulting & Other Services. While we believe IBM is more competitive in cloud due to its cost advantage and greater breadth of cloud and AI-related services, we believe Oracle edges out IBM in Software and IT Consulting & Other Services segments due to its advantages in database and ERP software with wider features as well as its IT consulting segment supporting its company growth.
Profitability Reigns Supreme
Next, we compared both companies in terms of their profitability by analyzing their gross, EBIT, net and FCF margins. Furthermore, we compared their ROA, ROE and ROCE ratios along with asset and equity turnover ratios.
Earnings and Margins
Company Data, Khaveen Investments Company Data, Khaveen Investments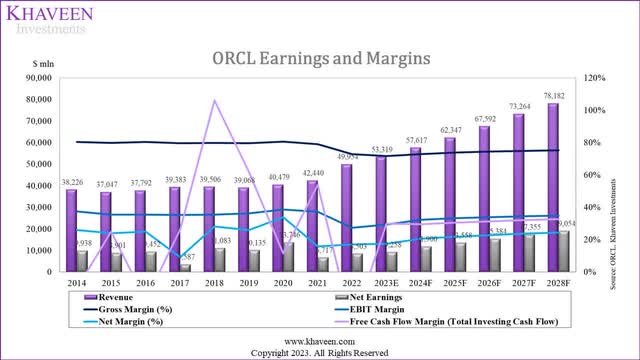
|
Margins |
Oracle (10-years) |
IBM (10-years) |
Oracle (5-years) |
IBM (5-years) |
Oracle (5-years Forward) |
IBM (5-years Forward) |
|
Revenue Growth |
6.03% |
-4.05% |
3.35% |
-4.04% |
7.96% |
5.66% |
|
Gross Margin |
76.75% |
54.99% |
78.34% |
51.60% |
74.22% |
57.16% |
|
EBIT Margin |
33.74% |
10.00% |
34.78% |
14.10% |
33.74% |
16.81% |
|
Net Margin |
22.60% |
10.26% |
22.52% |
11.35% |
22.64% |
12.71% |
|
Free Cash Flow Margin |
24.25% |
9.49% |
25.12% |
10.90% |
31.24% |
15.98% |
Source: Company Data, Khaveen Investments
Based on the charts, Oracle has shown a positive average revenue growth of 3.35% in the past 5 years and 6.03% in the past 10 years, while IBM has experienced a slight decline of -4.04% and -4.05% respectively. In terms of profitability margins, Oracle has consistently maintained higher margins than IBM in all gross, EBIT, net and FCF margins, highlighting Oracles strength against IBM.
Furthermore, based on our forecasts, we expected Oracle to maintain better forward average profit margins and revenue growth than IBM. However, we projected IBMs margins to improve going forward whereas we expect Oracles margins to moderate as it focuses on its expansion of data centers plan incurring significant capex to support its cloud growth as mentioned in its latest earnings briefing with management guiding $7.25 bln in capex at the midpoint this year.
|
Profitability Analysis |
Oracle (10-years Average) |
IBM (10-years Average) |
Oracle (5-years Forward) |
IBM (5-years Forward) |
|
ROA |
8.0% |
6.2% |
9.0% |
4.0% |
|
ROCE |
14.6% |
10.9% |
15.6% |
6.1% |
|
ROE |
123.4% |
45.9% |
55.1% |
26.0% |
|
Asset Turnover |
0.36x |
0.46x |
0.40x |
0.26x |
|
Equity Turnover |
4.11x |
0.53x |
2.45x |
0.43x |
Source: Company Data, Khaveen Investments
In addition, Oracle outperforms IBM with a higher 10-year average ROA (8.0% vs. 6.2%) and ROCE (14.6% vs. 10.9%) indicating better asset and capital utilization. Furthermore, Oracle has a total ROE of 123.4%, which is significantly higher than IBM’s 45.9% with a higher Equity Turnover of 4.11x versus IBM’s 0.53x. Looking forward, we anticipate Oracle to maintain a higher average ROA (9% vs 4%), along with higher ROCE (15.6% vs 6.1%), and ROE (55.1% vs 26%). Thus, we believe Oracle edges out IBM in our Profitability Analysis.
Conclusion
|
Factor |
Advantage |
|
Earnings and Margins |
Oracle |
|
Profitability Analysis |
Oracle |
Source: Company Data, Khaveen Investments
Overall, we believe Oracle is superior to IBM in both Earnings and Margins and Profitability Analysis comparisons with higher profitability margins across gross, EBIT, net and FCF margins, which indicates the higher profitability of its businesses, as well as better profitability ratios in terms of ROA, ROCE and ROE, highlighting its more efficient use of assets and capital to generate returns. Notwithstanding, based on our forecasts, we modeled Oracles profitability margins to remain superior compared to IBM, which we believe could be supported by its stronger competitiveness in key market segments as mentioned in the first point.
Financial Position Provides Solid Structure
In the final point, we compared both companies in terms of their financial position, analyzing their net debt trends as well as credit and liquidity ratios.
Net Debt
Company Data, Khaveen Investments Company Data, Khaveen Investments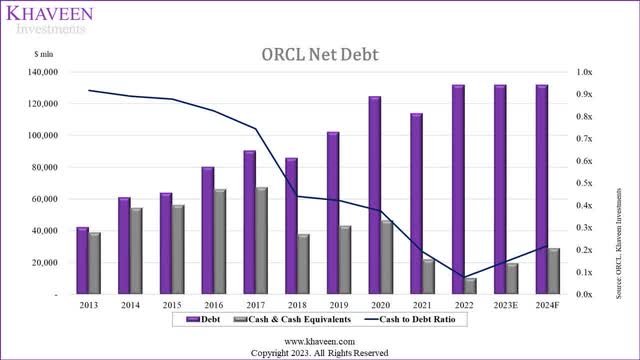
|
Net Debt ($ mln) |
Oracle (TTM) |
IBM (TTM) |
Oracle (2024F) |
IBM (2024F) |
|
Debt |
129,242 |
108,496 |
131,624 |
108,496 |
|
Cash & Cash Equivalents |
9,904 |
13,441 |
28,933 |
10,527 |
|
Net Debt (Net Cash) |
119,338 |
95,055 |
102,691 |
97,969 |
|
Cash to Debt Ratio |
0.1x |
0.1x |
0.2x |
0.1x |
Source: Company Data, Khaveen Investments
Oracle has a total debt of $129.24 bln and cash & cash equivalents of $9.9 bln, for a net debt of $119.34 bln. Similarly, IBM’s debt and cash & cash equivalents totaled $108.5 bln and $13.44 bln, respectively, resulting in a net debt of 95 bln. Both companies have a cash-to-debt ratio of 0.1x. Based on our projections, we modeled Oracle and IBM to maintain similar debt levels, but we expect Oracle to have more than 2x higher cash than IBM supported by its superior FCF margins, leading to an improvement for Oracles cash-to-debt ratio to 0.2x while we forecasted IBMs ratio to remain similar to TTM. Thus, we believe Oracle has a better financial position in terms of its net debt.
|
Credit Analysis |
Oracle (10-years Average) |
IBM (10-years Average) |
Oracle (5-years Forward) |
IBM (5-years Forward) |
|
EBIT interest coverage |
10.8x |
14.3x |
5.5x |
9.0x |
|
EBITDA interest coverage |
13.0x |
20.5x |
7.3x |
13.4x |
|
CFO interest coverage |
11.1x |
20.1x |
6.0x |
10.2x |
|
FCF interest coverage |
8.0x |
10.2x |
5.1x |
8.5x |
|
EBITDA/Total Debt |
0.2x |
0.1x |
0.2x |
0.2x |
|
EBITDA/Net Debt |
0.8x |
0.2x |
0.4x |
0.2x |
Source: Company Data, Khaveen Investments
Moving to the Credit Analysis, both Oracle and IBM have high-interest coverage ratios in the 10-year average, indicating that the companies have strong abilities to service their interest payments. However, IBM generally has higher ratios across all EBIT, EBITDA, CFO and FCF interest coverage ratios, highlighting its superior interest coverage against Oracle. Though, Oracle has slightly higher EBITDA to Debt ratios compared to IBM.
Over the next 5 years, we forecasted both Oracle and IBMs interest coverage ratios to moderate but remain positive with IBM continuing to maintain its advantage against Oracle whereas we expect Oracle to continue to maintain slightly higher EBITDA to net debt than IBM. Thus, we believe IBM continues to outperform Oracle in credit analysis.
|
Liquidity Analysis |
Oracle (10-years Average) |
IBM (10-years Average) |
Oracle (5-years Forward) |
IBM (5-years Forward) |
|
Cash Ratio |
7.29x |
0.30x |
2.27x |
0.45x |
|
Quick Ratio |
7.78x |
0.52x |
2.65x |
0.71x |
|
Current Ratio |
25.28x |
1.08x |
2.82x |
1.06x |
|
Debt/Assets |
50.21x |
0.85x |
0.73x |
0.83x |
|
Debt/Equity |
47.95x |
5.52x |
3.10x |
4.73x |
|
Assets/Equity (Financial Leverage) |
17.09x |
6.79x |
4.14x |
5.95x |
Source: Company Data, Khaveen Investments
Finally, in terms of Liquidity Analysis, Oracle outperforms IBM with stronger 10-year average cash, quick and current ratios, supporting its ability to meet short-term debt obligations. However, Oracle has higher leverage, with a Debt/Assets ratio of 50.21x and a Debt/Equity ratio of 47.95x, indicating a greater reliance on debt for financing. In contrast, IBM’s ratios are more moderate.
Based on our model forecasts, we expect Oracle to continue having better liquidity ratios compared to IBM in terms of cash, quick and current ratios although the ratios are lower compared to its past 10-year average. Furthermore, we expect its debt-to-assets and debt-to-equity ratios to show a strong improvement as it pays down its debt with its strong and robust cash generation abilities. Thus, we believe Oracle edges out IBM in our Liquidity Analysis.
Conclusion
|
Factor |
Advantage |
|
Net Debt |
Oracle |
|
Credit Analysis |
IBM |
|
Liquidity Analysis |
Oracle |
|
Overall |
Oracle |
Source: Khaveen Investments
Overall, we believe Oracle edges out IBM in terms of Financial Position comparison due to our expectations of a greater improvement to its net debt with a forecasted improvement to its cash-to-debt ratio supported by its stronger cash flows compared to IBM. Furthermore, we believe Oracles strong liquidity ratios in terms of cash, quick and current ratios support its liquidity to meet short-term obligations. However, we see Oracle being surpassed by IBM only in Credit Analysis due to its superior interest coverage ratios.
Risk: Competition from Microsoft
Across most of the business segments of both Oracle and IBM, we believe Microsoft is a key competitor with strong share gains such as in database software and cloud. In cloud, we highlighted Microsofts larger scale of its data center presence globally and a wider breadth of cloud services. Furthermore, we believe its cloud business supports its growth in the cloud database software market, gaining share from Oracle itself. While we believe Oracle edges out IBM, we see it facing threats from Microsoft, which we had forecasted to grow at a higher forward average growth rate with a 5-year average of 17.8% compared to 8% for Oracle, driven by its strong growth in Azure and AI integrations with Copilot.
Valuation
Khaveen Investments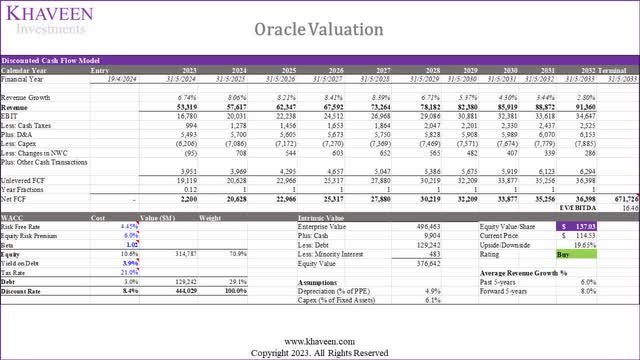
Overall, we believe Oracle edges out IBM and we updated our valuation for the company, maintaining our previous revenue growth forecasts from our previous analysis beyond 2024 with updated 2023 figures based on prorated Q1 to Q3 revenues. Based on a discount rate of 8.4% (companys WACC), and terminal value based on its 5-year average EV/EBITDA of 16.46x, our model shows an upside of 19.65% for Oracle.
Verdict
|
Factor |
Advantage |
|
Growth Outlook |
Oracle |
|
Profitability |
Oracle |
|
Financial Position |
Oracle |
|
Overall |
Oracle |
Source: Khaveen Investments
In summary, we assert that Oracle holds a comprehensive advantage over IBM in all 3 areas analyzed which are its growth outlook, profitability and financial position. In terms of Growth Outlook, Oracle surpasses IBM in revenue performance and competitiveness, boasting a larger market share in Software and a more extensive product offering despite IBM’s slightly larger market share in certain segments such as cloud and servers. In terms of profitability, Oracle surpasses IBM in terms of higher margins across various metrics and better profitability ratios, reflecting its more efficient use of assets and capital. We expect based on our forecasts for Oracle’s profitability margins to continue to outshine IBM’s, driven by its strong competitiveness in key software market segments. Moreover, in terms of financial position, we anticipate Oracle to improve its net debt and cash-to-debt ratio, supported by stronger cash flows compared to IBM. Finally, we believe Oracle’s robust liquidity ratios position it well to meet short-term obligations. Based on our updated DCF valuation, we derived a price target of $137.83 for Oracle, higher than our previous price target of $115.41, due to revision to our assumptions for its profitability to improve, thus we rate Oracle as a Buy.